
Tool 7.1 - Requirements Filtering (Backlog + MoSCoW)
WHAT
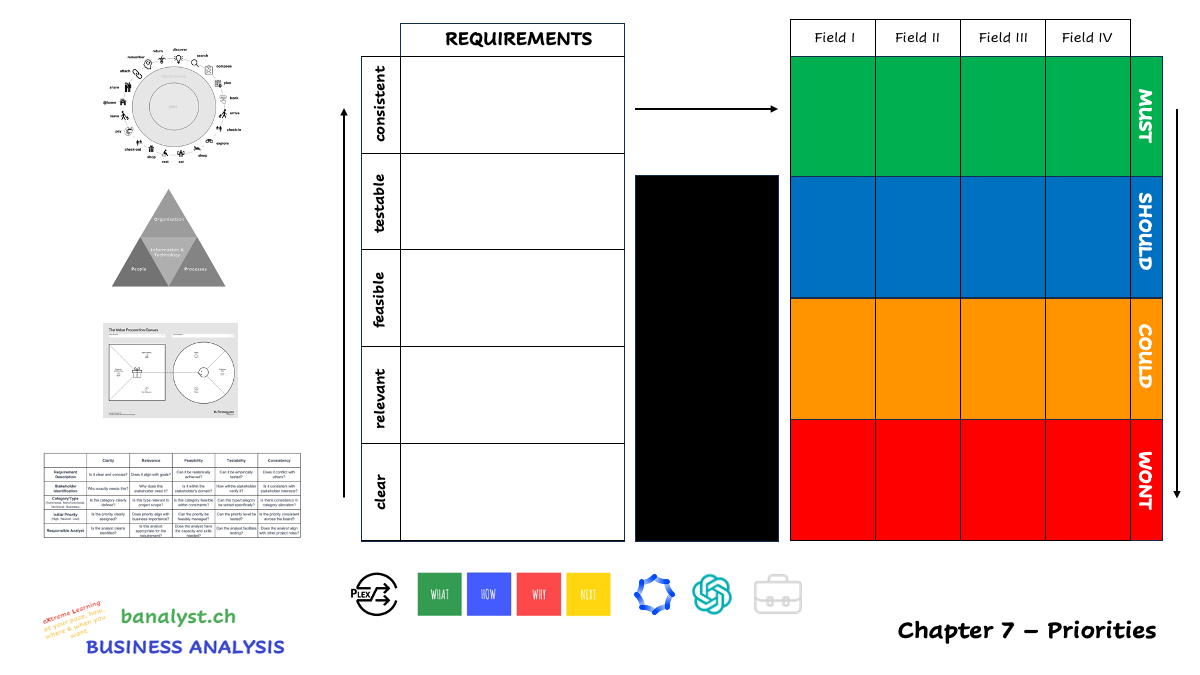
A Requirements Filtering Map is a visualization tool that guides business analysts through the process of vetting and prioritizing project requirements. It typically starts with an initial backlog where each requirement is evaluated for clarity, relevance, feasibility, testability, and consistency. Requirements that meet all these criteria are then shifted to a prioritization phase, often using the MoSCoW method, which stands for Must have, Should have, Could have, and Won't have, to determine their necessity for the project. This methodical approach ensures that the most critical and high-value requirements are identified and addressed first. By clustering similar requirements, analysts can manage complex projects more efficiently, focusing on delivering the highest value features within constraints.
HOW
To create and use a Requirements Filtering Map, begin with these steps:
Gather Requirements: Start by collecting all the requirements for your project from various stakeholders and sources.
Create the Backlog: Organize the gathered requirements into a backlog on the left side of the map. This is your starting point for filtering.
Apply Filters: Evaluate each requirement against a series of filters. The filters typically follow a sequence such as: clear (is the requirement understandable?), relevant (does it align with business objectives?), feasible (can it be done with current resources and technology?), testable (can it be measured or tested?), and consistent (does it conflict with other requirements?).
Prioritize with MoSCoW: Requirements that pass through the filters are then moved to the MoSCoW prioritization matrix. Assign each requirement to one of the categories: Must have (essential to project success), Should have (important but not vital), Could have (desirable but not necessary), or Won’t have (least critical or not needed at this time).
Cluster and Manage: If dealing with numerous requirements, cluster them into fields to manage them more effectively. Each field represents a group of related requirements.
In practice, as requirements are assessed and pass through each filter, they are moved closer to the MoSCoW section. Here they are sorted into the categories, helping teams focus on the most critical aspects for the project's success. This map serves as a living document throughout the project lifecycle, with requirements potentially being re-evaluated and re-prioritized as the project evolves and more information becomes available.
WHY
A Requirements Filtering Map is created during Business Analysis to provide a structured approach to requirement prioritization, ensuring that the development process is aligned with business goals and stakeholder expectations. It serves several key purposes:
Clarity and Focus: It helps in clarifying the requirements by ensuring they are well-defined and understood, focusing on what is essential to achieve business objectives.
Alignment and Relevance: It ensures that requirements are aligned with the strategic vision and are relevant to the project's success, filtering out any that do not contribute to the end goals.
Feasibility and Viability: By assessing feasibility and testability, it ensures that the requirements can be implemented within the project's technical and resource constraints and that their success can be measured.
Consensus and Communication: It facilitates communication and consensus-building among stakeholders by making it clear why certain requirements are prioritized over others, thereby managing expectations effectively.
Efficient Resource Allocation: By prioritizing requirements, it aids in the efficient allocation of resources, ensuring that the most critical 'must-haves' are addressed first and optional 'could-haves' are scheduled appropriately.
NEXT
Here is a explanation of how a Requirements Filtering Map can influence the chapters of the business analysis report:
- Introduction (1.3 Methodology and approach) - Outline how the Requirements Filtering Map was used as part of the project’s analytical methodology.
- Problem Statement (2.1 Definition of the problem) - Integrate the filtered requirements that define the scope of the problem being addressed.
- Customer Analysis (4.2 Customer needs and pain points) - Include the customer-focused requirements that have been identified as clear, relevant, feasible, testable, and consistent.
- Solution Options (6.1 Alternative solutions, 6.2 Evaluation criteria) - Reflect on how the requirements identified in the filtering process shaped the development of alternative solutions and the criteria for their evaluation.
- Business Case Development (7.1 Cost-benefit analysis, 7.3 Risk assessment and management) - Use the prioritized requirements to determine potential costs, benefits, and risks associated with each requirement.
- Implementation Plan (8.1 Project scope and timeline, 8.2 Resource and budget requirements) - Align the 'Must have' and 'Should have' requirements with the project scope, timeline, and resource allocation.
- Requirements (9.1 Functional requirements, 9.2 Priorities) - The functional requirements section should be directly informed by the consistent requirements from the filtering process, along with their prioritization according to the MoSCoW method.
- Conclusion (10.1 Summary of findings and recommendations) - Summarize how the Requirements Filtering Map influenced the project findings and the basis of recommendations.
PROMPT
[instruction]
Based on the [case], the [pestel],[swot],[porters], [business context], [power-interest], [stakeholder-trend], [opportunities], [risks], [fishbone], [catwoe], [current story], [future story] the different [persona], the [force field analysis], [gaps], [popit], [value proposition canvas] and [rasci] table above, represent a typical sample [moscow] analysis. Put the dimensions of the moscow between [ ] and bullet list the requirements derived from the activities of the [rasci] for each dimension. Cluster theses requirements into four major fields a present this as a table with the moscow dimensions in the rows, the fields in the columns, and the bullet listed requirements in the cells.
[instruction]
Give some sample requirements that have not made it into this table because they are either not clear, not relevant, not feasible, not testable or not consistent. List at least three requirements for each of these shortcomings.
CREDITS
Course : Business Analysis & Requirements Engineering
Institution : HES-SO Valais Wallis, 3960 Sierre
Teachers : Thomas Steiner & Catherine Tacchini
Credits
- FTO : X.XX ECTS
- FIG : X.XX ECTS
Objectives (with Babok 3 chapters)
- I follow rules in identifying an effective decision-making process. 3.3.4.1
- I understand change control processes. 3.3.4.2
- I understand change strategy. 6.4
- I have basic knowledge of an effective prioritisation process. 3.3.4.3
- I understand determining the appropriate basis for prioritizing requirements. 5.3.4.1
- I have basic knowledge of guiding stakeholders through prioritising requirements. 5.3.4.2
- I have basic knowledge of prioritising new information. 5.3.4.3
- I understand managing conflicts and resolving issues. 5.5.4.2
- I understand using appropriate methods to gain consensus about key BA information. 5.5.4.3
- I have applied Requirements Filtering. case study
EXPLAINED
video explanations follow
PLEX
A PLEX, or Peer LEarning eXperience, is a self-contained, micro-learning unit created by students or teachers, designed to answer key questions like 'what?', 'how?', 'why?', and 'what's next?'. Each PLEX clearly outlines its learning objectives, associated micro-credits, and provides details about its original authors and their affiliations, making it a versatile resource for integration into various learning environments.
BACKLOG
The Backlog part of a Requirements Filtering Map or any project management framework such as Agile is essentially a dynamic list of all the work or changes required in a project. It includes new features, changes to existing features, bug fixes, infrastructure changes, and other activities to ensure the project progresses and meets its objectives. The Backlog is prioritized so that the team always works on the most valuable tasks first. It's a live document that is constantly updated and reprioritized as work is completed, new work is identified, and the project evolves. In essence, it's the roadmap that guides the development team on what to work on next.
MOSCOW
The MoSCoW part of a Requirements Filtering Map refers to a prioritization technique used in project management and business analysis to categorize requirements into four groups:
Must have: These are non-negotiable requirements that the project needs for it to be successful. They are critical to the current delivery timebox and if not completed, will result in the project failing.
Should have: These are important but not vital requirements. They are high priority and should be included in the solution if it is possible to do so without impacting the delivery of the 'Must have' requirements.
Could have: These are desirable requirements that have a lower priority. They could improve user satisfaction or the overall experience but are not essential for delivery in the current timebox.
Won't have (for now): These are the least critical, lowest payback items, or not appropriate at this time. They are typically not planned into the schedule but may be considered for the future.
Customer Journey
Analyzing the Customer Journey with its touchpoints and associated pains can significantly contribute to establishing a Requirements Filtering Map by providing a clear understanding of customer interactions and their pain points. Here's how it can help:
-
Identifying Clear Requirements: The touchpoints reveal specific interactions customers have with the service or product. By examining these interactions, clear requirements can be identified that address the needs highlighted at each stage of the journey.
-
Determining Relevance: Understanding customer pains at each touchpoint helps determine the relevance of requirements. Requirements that directly address these pains are more likely to be considered relevant as they improve the customer experience.
-
Assessing Feasibility: Customer feedback and behavior at touchpoints can inform the feasibility of proposed changes or features. If a pain point is frequently noted, it indicates that addressing it is not only feasible but necessary.
-
Defining Testability: A well-documented customer journey provides measurable experiences at each touchpoint, which can guide the creation of test cases that are directly linked to customer satisfaction and business outcomes.
-
Ensuring Consistency: Aligning requirements with the customer journey ensures that changes are consistent with the overall customer experience strategy and don't create new pains or negative impacts at other touchpoints.
POPIT
A POPIT analysis can greatly enhance the establishment of a Requirements Filtering Map by ensuring that all aspects of organizational change are considered when gathering and prioritizing requirements. Here's how each dimension of POPIT can contribute:
-
People: This dimension helps identify the human-related requirements, such as training needs, changes in job roles, and communication plans. It ensures that the requirements consider the impact on staff and their alignment with the organizational culture and skills.
-
Organization: Analyzing organizational structures can reveal requirements related to changes in governance, process alignments, and policy updates needed to support the new solution.
-
Processes: This helps pinpoint process-related requirements, including workflow improvements, procedural changes, and enhancements to efficiency and quality control measures.
-
Information Technology: By evaluating the current IT landscape, requirements for new systems, upgrades, integrations, and data management protocols can be identified, ensuring that technological capabilities support the new solution.
Value Proposition Canvas
A Value Proposition Canvas (VPC) can help in establishing a Requirements Filtering Map by aligning product features with customer desires, which informs the prioritization of requirements. Here’s how:
-
Customer Jobs: Understanding what customers are trying to accomplish can lead to clear requirements for features or services that help them complete these jobs.
-
Pains: By identifying customer pains, the VPC helps pinpoint critical areas where solutions are needed, thus outlining the 'Must haves' and 'Should haves' in the MoSCoW prioritization.
-
Gains: Knowing the gains that customers expect can lead to the development of 'Could haves' requirements that enhance customer satisfaction but may not be as urgent.
-
Pain Relievers and Gain Creators: These directly inform the 'clear' and 'feasible' aspects of the requirements, ensuring that what is developed will be relevant and valuable to the customer.
-
Products and Services: This section ensures that the requirements are consistent with what the organization can offer and helps to refine the scope of what should be developed or improved.
Criteria for Filtering
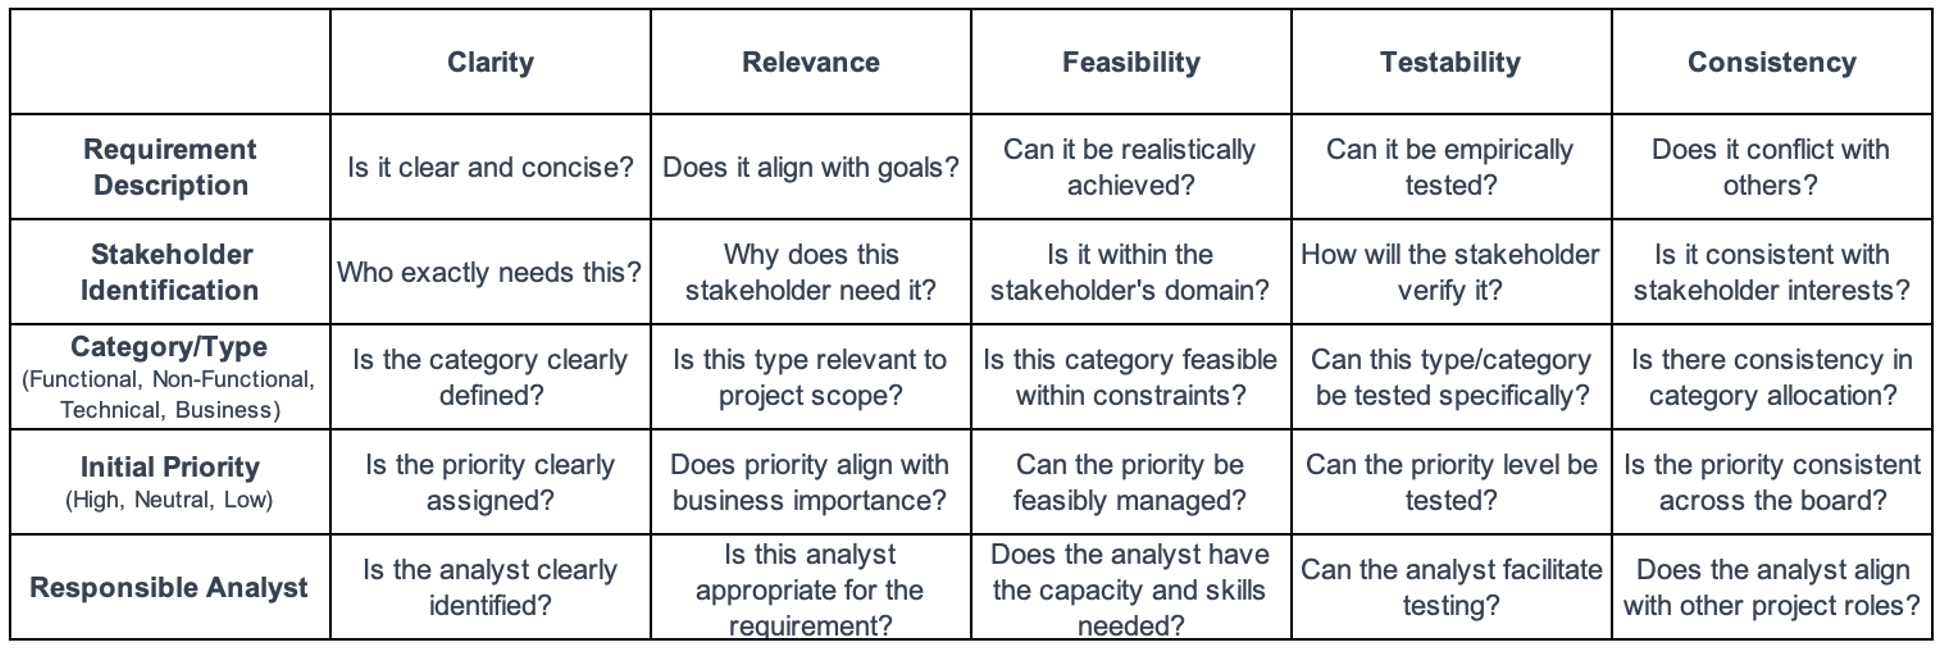
This table provides a structured approach to filtering and classifying requirements in a project's backlog. Each column represents a criterion for evaluation:
-
Clarity: Assesses whether each requirement is clearly defined and understandable. Clear requirements are less prone to misinterpretation and thus reduce the risk of rework or scope creep.
-
Relevance: Evaluates if the requirement aligns with the project's goals and objectives, ensuring that the work remains focused on delivering value that is in line with business or stakeholder needs.
-
Feasibility: Determines whether the requirement can realistically be achieved given the project's current context, resources, and constraints. This prevents the allocation of resources to requirements that are not practical to implement.
-
Testability: Checks if the requirement can be empirically tested, which is critical for verification and validation purposes. Testable requirements help maintain quality and ensure that the final product meets the expected standards.
-
Consistency: Ensures the requirement does not conflict with other requirements and that it's in harmony with the project's overall scope and stakeholder interests.
Each row provides a different aspect to consider for each requirement:
- Requirement Description
- Stakeholder Identification
- Category/Type
- Initial Priority
- Responsible Analyst
By addressing these criteria and aspects for each requirement, the project team can prioritize the backlog effectively, focusing on requirements that are crucial and viable, and preparing them for inclusion in project sprints or phases. This structured approach facilitates transparent communication among team members and stakeholders, promotes efficient project management, and helps in delivering a successful product or service.
Tool 7.2 - RASCI
WHAT
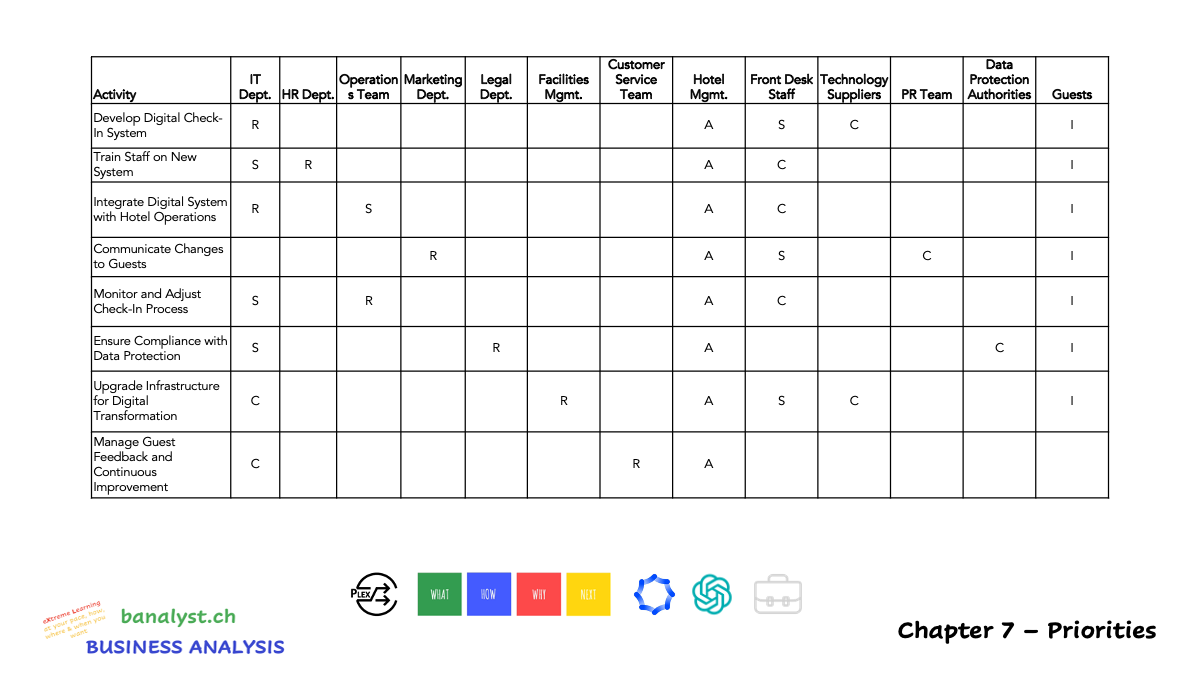
A RASCI chart is a matrix used in business analysis and project management to clarify the roles and responsibilities of individuals in a task, project, or process. The acronym stands for Responsible, Accountable, Supporting, Consulted, and Informed. Each task or activity is listed, and individuals or groups are assigned to one of these roles, ensuring clarity in who is doing the work, who has decision authority, who needs to support the task, who should be consulted for input, and who must be kept informed on progress. It helps prevent confusion over roles, streamlines communication, and establishes accountability. RASCI is a vital tool for managing complex projects and ensuring efficient team collaboration.
HOW
Creating a RASCI chart involves a few structured steps:
-
Identify Tasks and Processes: List all the tasks, activities, and processes that need to be accomplished within a project or operational workflow.
-
Define Roles: Determine all the roles involved in the project or process. These could be individuals, departments, or external entities.
-
Assign RASCI Values: For each task, assign roles by using the RASCI values:
- Responsible (R): The person(s) who will perform the task.
- Accountable (A): The person(s) ultimately answerable for the correct and thorough completion of the task. There should be only one Accountable per task to ensure clear ownership.
- Supporting (S): The individuals or groups who provide additional support to the task execution.
- Consulted (C): Those whose opinions are sought; typically, these are subject-matter experts.
- Informed (I): Those who need to be kept informed about task progress or completion.
-
Create the Chart: Draw up a matrix with tasks listed in rows and the roles or people in columns. Place the RASCI assignments at the intersection of tasks and roles.
-
Review and Communicate: Review the chart with your team to ensure clarity and agreement on roles and responsibilities. Then, communicate the RASCI chart to all stakeholders involved to ensure everyone understands their roles and the expectations.
WHY
A RASCI chart is done in Business Analysis to ensure clear distribution of roles and responsibilities among project team members and stakeholders. It helps to clarify who is accountable for what tasks, minimizing overlaps and gaps in roles, which can lead to inefficiencies or confusion. The chart is instrumental in establishing expectations for collaboration, communication, and decision-making, promoting a shared understanding among all participants. This level of clarity supports effective teamwork and can improve project outcomes by aligning everyone's efforts with the project's objectives. Moreover, it aids in risk management by identifying single points of failure where only one person is responsible or accountable for critical tasks.
NEXT
Here is a explanation of how a RASCI can influence the chapters of the business analysis report:
-
Introduction (1.3 Methodology and approach) - Include the RASCI analysis to describe the approach taken in managing project roles and responsibilities.
-
Problem Statement (2.2 Root cause analysis) - Utilize the RASCI chart to clarify who provided insight into the root causes of the problem.
-
Solution Options (6.1 Alternative solutions, 6.2 Evaluation criteria) - Discuss how different stakeholders, as defined in the RASCI chart, contributed to the development of alternative solutions and evaluation criteria.
-
Implementation Plan (8.1 Project scope and timeline, 8.3 Responsibilities) - Detail the responsibilities as defined by the RASCI chart, ensuring clarity on who is responsible for delivering various components of the project.
-
Requirements (9.1 Functional requirements) - Indicate who is responsible, accountable, supporting, consulted, and informed for the collection and validation of functional requirements.
-
Conclusion (10.2 Implications and next steps) - Reflect on how the RASCI chart will continue to inform roles and responsibilities moving forward.
PROMPT
[instruction]
Based on the [case], the [pestel],[swot],[porters], [business context], [power-interest], [stakeholder-trend], [opportunities], [risks], [fishbone], [catwoe], [current story], [future story] the different [persona], the [force field analysis], [gaps], [popit], [value proposition canvas] and [requirements filtering] above, create a [rasci] table. Present this table with the activities in the rows and the stakeholders in the columns. In the cells, put their roles / responsabibilités with one letter from RASCI. Be sure that each activity has at least one of each of the RASCI letters.
CREDITS
Course : Business Analysis & Requirements Engineering
Institution : HES-SO Valais Wallis, 3960 Sierre
Teachers : Thomas Steiner & Catherine Tacchini
Credits
- FTO : X.XX ECTS
- FIG : X.XX ECTS
Objectives (with Babok 3 chapters)
- I follow rules in identifying an effective decision-making process. 3.3.4.1
- I understand change control processes. 3.3.4.2
- I understand change strategy. 6.4
- I have basic knowledge of an effective prioritisation process. 3.3.4.3
- I understand determining the appropriate basis for prioritizing requirements. 5.3.4.1
- I have basic knowledge of guiding stakeholders through prioritising requirements. 5.3.4.2
- I have basic knowledge of prioritising new information. 5.3.4.3
- I understand managing conflicts and resolving issues. 5.5.4.2
- I understand using appropriate methods to gain consensus about key BA information. 5.5.4.3
- I have applied a RASCI chart. case study
EXPLAINED
video explanations follow
PLEX
A PLEX, or Peer LEarning eXperience, is a self-contained, micro-learning unit created by students or teachers, designed to answer key questions like 'what?', 'how?', 'why?', and 'what's next?'. Each PLEX clearly outlines its learning objectives, associated micro-credits, and provides details about its original authors and their affiliations, making it a versatile resource for integration into various learning environments.