Tool 4.1 - Opportunities-Risk Map
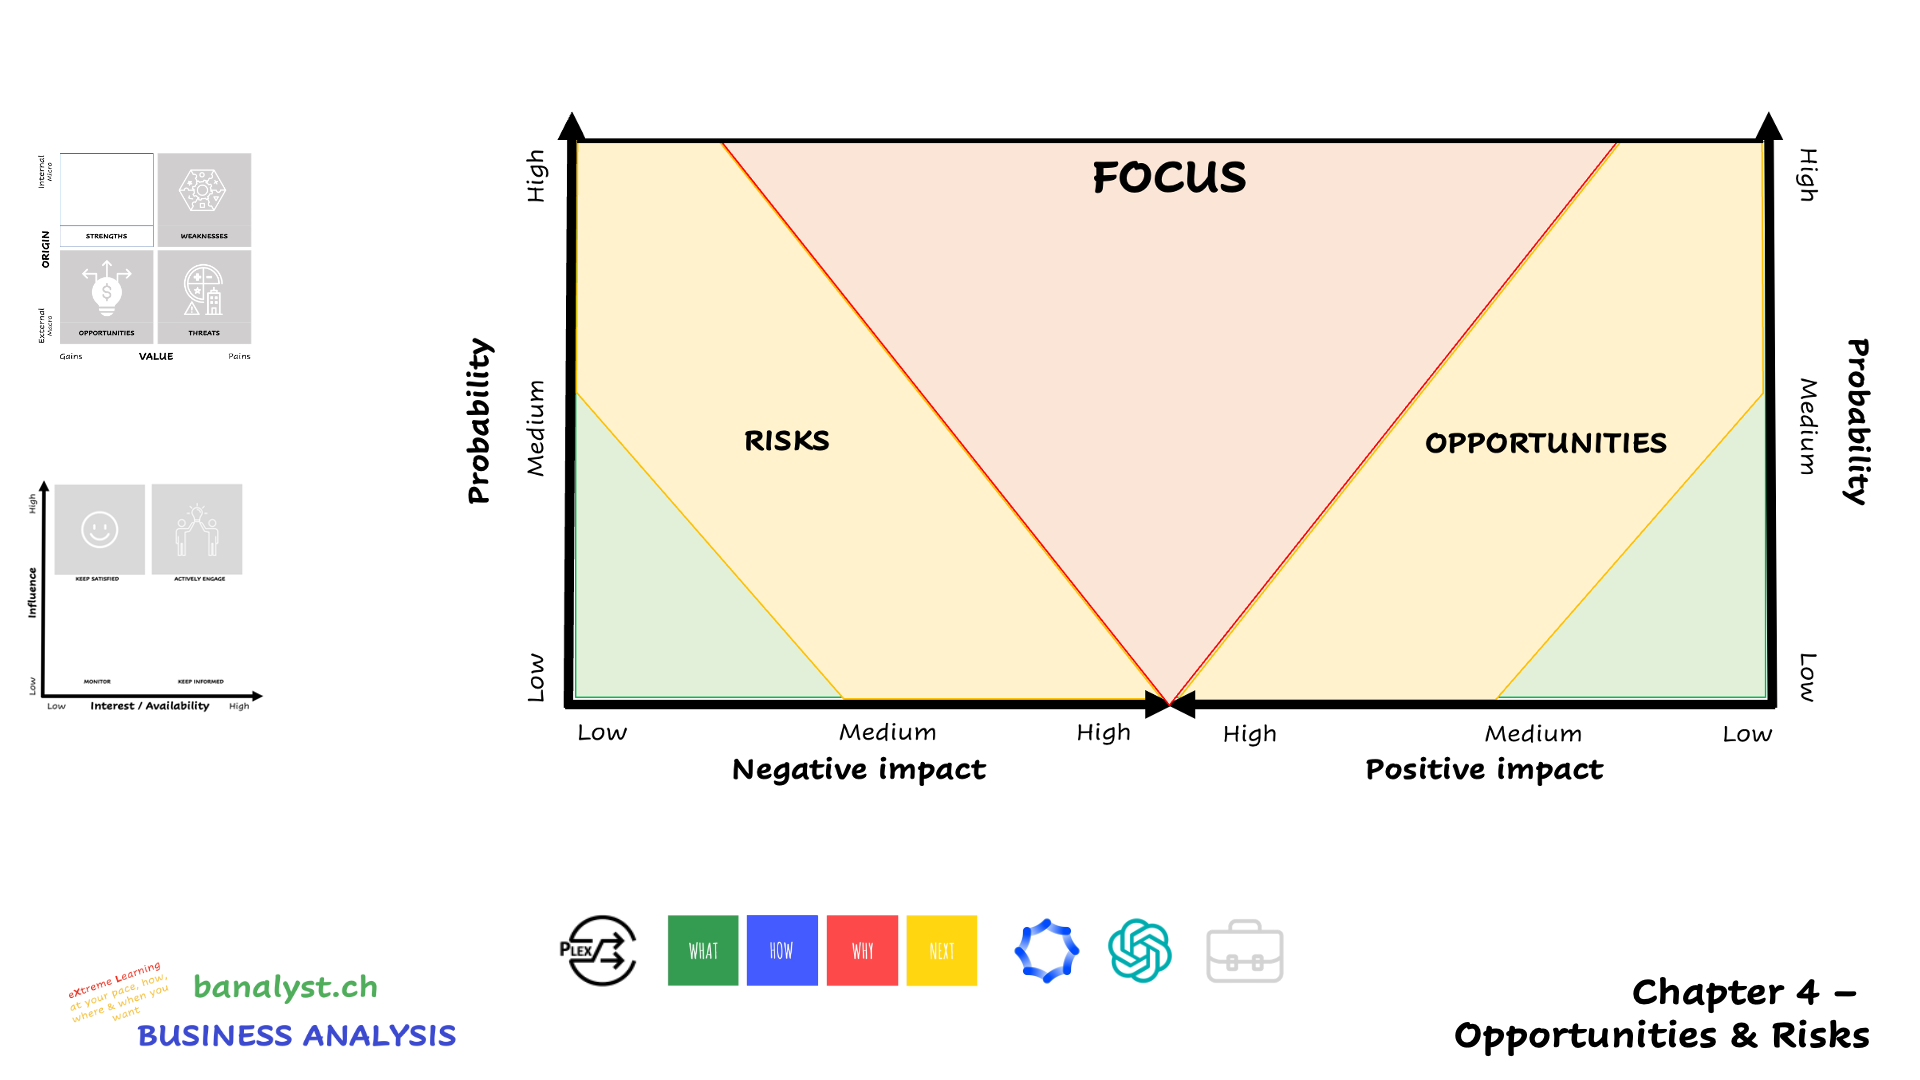
OPPORTUNITIES
In the Opportunities section of the map, external opportunities are identified, evaluated for their probability of occurrence and potential positive impact, and then strategically placed on the map. This section is divided into three levels: green for low probability and low impact opportunities, indicating lesser significance; yellow for moderate probability and/or impact, requiring careful consideration; and red for high probability and high impact opportunities, which are prioritized and demand immediate focus and action. This color-coded system visually guides strategic planning, helping prioritize opportunities based on their potential benefit and likelihood.
RISKS
The left part of the map focuses on identifying and assessing risks, evaluating each for its probability of occurrence and potential negative impact on the project or organization. Similar to the right side, it employs a color-coded system: green signifies risks with low probability and low impact, suggesting minimal concern; yellow represents moderate probability and/or impact, indicating a need for careful monitoring and preparedness; and red denotes high probability and high impact risks, which are critical and require immediate attention and mitigation strategies. This visual system aids in prioritizing risks and allocating resources effectively for risk management.
ARROW OF INTENTION
The upper red part of the Opportunities-Risks map, also known as the 'Arrow of Attention', is reserved for the most critical items: those with high probability and high impact, whether they are opportunities or risks. For opportunities, this area highlights those with significant potential benefits that are highly likely to occur, necessitating strategic focus and resource allocation for maximization. In terms of risks, it denotes those that are both highly probable and severely impactful, requiring immediate attention for mitigation to prevent substantial negative consequences.
WHAT
The Opportunities-Risks map is a strategic tool used in business analysis to visually represent and evaluate potential external factors that can affect an organization. It helps in identifying and categorizing opportunities that could benefit the organization and risks that might pose challenges. The map is typically divided into sections based on the probability of occurrence and the impact (positive for opportunities, negative for risks) of each factor. Opportunities and risks are plotted on this map, allowing analysts to prioritize them based on their significance and the urgency of addressing them. This tool aids in strategic decision-making, enabling businesses to capitalize on beneficial opportunities while effectively managing and mitigating risks.
HOW
- Identify and Evaluate Incoming Opportunities and Risks: Start by identifying potential opportunities and risks, using tools like SWOT analysis, market research, and stakeholder feedback. Each should be evaluated based on its likelihood of occurrence and potential impact (positive for opportunities, negative for risks).
- Use a Structured Approach for Placement: Place each identified opportunity and risk on the map according to its evaluated criteria. Opportunities and risks with high probability and high impact should be placed in the red zone (the 'Arrow of Attention'), indicating urgent attention is required.
- Consider the Green and Yellow Zones: Opportunities and risks with low probability and low impact should be placed in the green zone, implying they are less critical. Those with moderate probability and/or impact belong in the yellow zone, indicating they need regular monitoring.
- Balance and Prioritize: Strive for a balance between opportunities and risks. High-impact, high-probability items in the red zone should be prioritized for action, while keeping an eye on the yellow zone for evolving situations.
- Dynamic Review and Adjustment: Regularly review and update the map to reflect new information or changes in the business environment. This ensures that the map remains a relevant and effective tool for strategic decision-making and risk management.
WHY
- Strategic Insight: Creating an Opportunities-Risks map provides business analysts with a clear visual representation of the external factors that could impact the organization, enabling a more strategic approach to decision-making.
- Prioritization of Resources: By categorizing opportunities and risks based on their probability and impact, analysts can prioritize where to allocate resources, focusing on high-impact areas for maximum benefit and risk mitigation.
- Enhanced Risk Management: The map facilitates proactive risk management by highlighting potential threats that need immediate attention, allowing for the development of effective contingency plans and strategies.
- Opportunity Maximization: It helps in identifying and exploiting external opportunities that align with the organization's strengths and goals, fostering growth and competitive advantage.
- Stakeholder Communication: The visual and straightforward format of the Opportunities-Risks map makes it an excellent tool for communicating complex information to stakeholders, ensuring alignment and informed decision-making across the organization.
NEXT
Here is a explanation of how the Stakeholder-Trend Map can influence the chapters of the business analysis report:
- SWOT Analysis (5.3 Opportunities and 5.4 Threats) - to outline identified opportunities and risks.
- Solution Options (6.3 Recommendation and justification) - to factor in opportunities and risks when recommending solutions.
- Business Case Development (7.3 Risk assessment and management) - to assess how opportunities can enhance value and risks can be mitigated.
- Implementation Plan (8.2 Resource and budget requirements) - to prepare for leveraging opportunities and managing risks.
- Conclusion (10.2 Implications and next steps) - to summarize how opportunities and risks impact the analysis and future actions.
PROMPT
[instruction]
Based on the [case], the [pestel],[swot],[porters], [business context], [power-interest], [stakeholder-trend] analyses done above, do a opportunities-risks analysis. Return the result as a structured [opportunities] list with the following “probability” dimensions: low, medium, high and the following “positive impact” dimensions: low, medium, high. Then return also a structured [risks] list with the following “probability” dimensions: low, medium, high and the following “negative impact” dimensions: low, medium, high.
CREDITS
Course : Business Analysis & Requirements Engineering
Institution : HES-SO Valais Wallis, 3960 Sierre
Teachers : Thomas Steiner & Catherine Tacchini
Credits
- FTO : X.XX ECTS
- FIG : X.XX ECTS
Objectives (with Babok 3 chapters)
- I understand comparing elicitation results against source information. 4.3.4.1
- I understand comparing elicitation results against other elicitation results. 4.3.4.2
- I understand current state. 6.1
- I understand future state. 6.2
- I follow rules for risk analysis. 6.3
- I have basic knowledge of identifying assumptions in order to manage risks. 7.3.4.1
- I have applied the opportunities-risk map. (case study)
EXPLAINED
video explanations follow
PLEX
A PLEX, or Peer LEarning eXperience, is a self-contained, micro-learning unit created by students or teachers, designed to answer key questions like 'what?', 'how?', 'why?', and 'what's next?'. Each PLEX clearly outlines its learning objectives, associated micro-credits, and provides details about its original authors and their affiliations, making it a versatile resource for integration into various learning environments.
Link to SWOT analysis
When using a SWOT (Strengths, Weaknesses, Opportunities, Threats) analysis as a precursor to creating an Opportunities-Risks map, the results from the SWOT analysis can be invaluable in identifying candidate risks and opportunities. Here's how the process typically works:
Utilizing Strengths and Weaknesses:
Strengths: These are internal positive attributes of your organization. While strengths themselves are not directly transferred to the Opportunities-Risks map, they can help in recognizing external opportunities that your organization is well-placed to exploit.
Weaknesses: These are internal negative attributes. Understanding your weaknesses can help identify internal risks that may exacerbate external threats or hinder the exploitation of opportunities.
Transferring Opportunities and Threats:
Opportunities (from SWOT): These are external favorable conditions that can give your organization a competitive advantage. These opportunities identified in the SWOT analysis are directly relevant to the Opportunities section of the Opportunities-Risks map. You evaluate each opportunity based on its probability of occurrence and potential positive impact.
Threats (from SWOT): These are external factors that could jeopardize your organization's performance. Similar to opportunities, threats identified in the SWOT analysis are directly relevant to the Risks section of the Opportunities-Risks map. Each threat is evaluated based on its likelihood and potential negative impact.
Prioritizing High-Impact Factors:
The Opportunities-Risks map allows for the prioritization of the high-impact and high-probability items identified in the SWOT analysis. By placing these items in the “arrow of attention,” you can focus on the most crucial aspects that need immediate attention or strategic planning.
Balancing Opportunities and Risks:
The map helps in balancing opportunities against risks. For instance, a high-impact opportunity might outweigh a particular risk, or a significant risk might necessitate a reevaluation of a potential opportunity. This balance is crucial for informed decision-making and strategic planning.
In summary, a SWOT analysis provides a comprehensive overview of the internal and external factors affecting an organization. Transferring the opportunities and threats identified in a SWOT analysis to an Opportunities-Risks map helps in further analyzing these factors, focusing on their probability and impact, and thus aids in strategic prioritization and decision-making.
Link to stakeholder POWER-INTEREST analysis
When incorporating the results of a Stakeholder Power-Interest analysis into an Opportunities-Risks map, the focus on stakeholders with high interest/high influence and low interest/high influence can be particularly insightful for identifying candidate risks and opportunities. Here's how this can be approached:
High Interest / High Influence Stakeholders:
These stakeholders are highly engaged and have significant power to impact your project or organization.
Opportunities: Their high interest can lead to opportunities for collaboration, support, and advocacy. For example, a stakeholder in this category might provide crucial resources or expertise, or could champion your project within their networks.
Risks: Conversely, the high influence of these stakeholders also means that their opposition or negative perceptions can pose significant risks. This could include withdrawal of support, active resistance, or influencing others against your interests.
Low Interest / High Influence Stakeholders:
These stakeholders have the power to impact your project or organization but currently have low engagement or interest.
Opportunities: The opportunity here lies in engaging these stakeholders more effectively. By increasing their interest in your project, you can leverage their high influence for positive outcomes. This could involve tailored communication strategies or involving them in key decision-making processes.
Risks: The risk is that these stakeholders, due to their high influence, might inadvertently or deliberately impact your project negatively if their interests become threatened or if they are swayed by opponents. Their low interest might also mean they are less informed about your project, leading to misunderstandings.
Utilizing the Analysis in the Opportunities-Risks Map:
On the map, you can allocate specific opportunities and risks identified through interactions with these stakeholders. For high interest/high influence stakeholders, this might include strategic alliances or partnership risks. For low interest/high influence stakeholders, risks might revolve around engagement challenges, while opportunities could focus on outreach and engagement strategies.
Balancing and Prioritizing:
The Opportunities-Risks map helps in balancing these elements. For instance, a risk identified with a high influence/low interest stakeholder might be mitigated by an opportunity derived from a high influence/high interest stakeholder.
Prioritizing actions on the map can be aligned with stakeholder management strategies, focusing resources and attention where they can have the most significant impact.
In summary, the Power-Interest analysis of stakeholders provides a nuanced view of where risks and opportunities might arise based on stakeholder dynamics. By understanding the level of interest and influence of each stakeholder group, you can more effectively identify and prioritize risks and opportunities on your Opportunities-Risks map, leading to more strategic and targeted stakeholder engagement and project management.
Tool 4.2 - Fishbone diagram
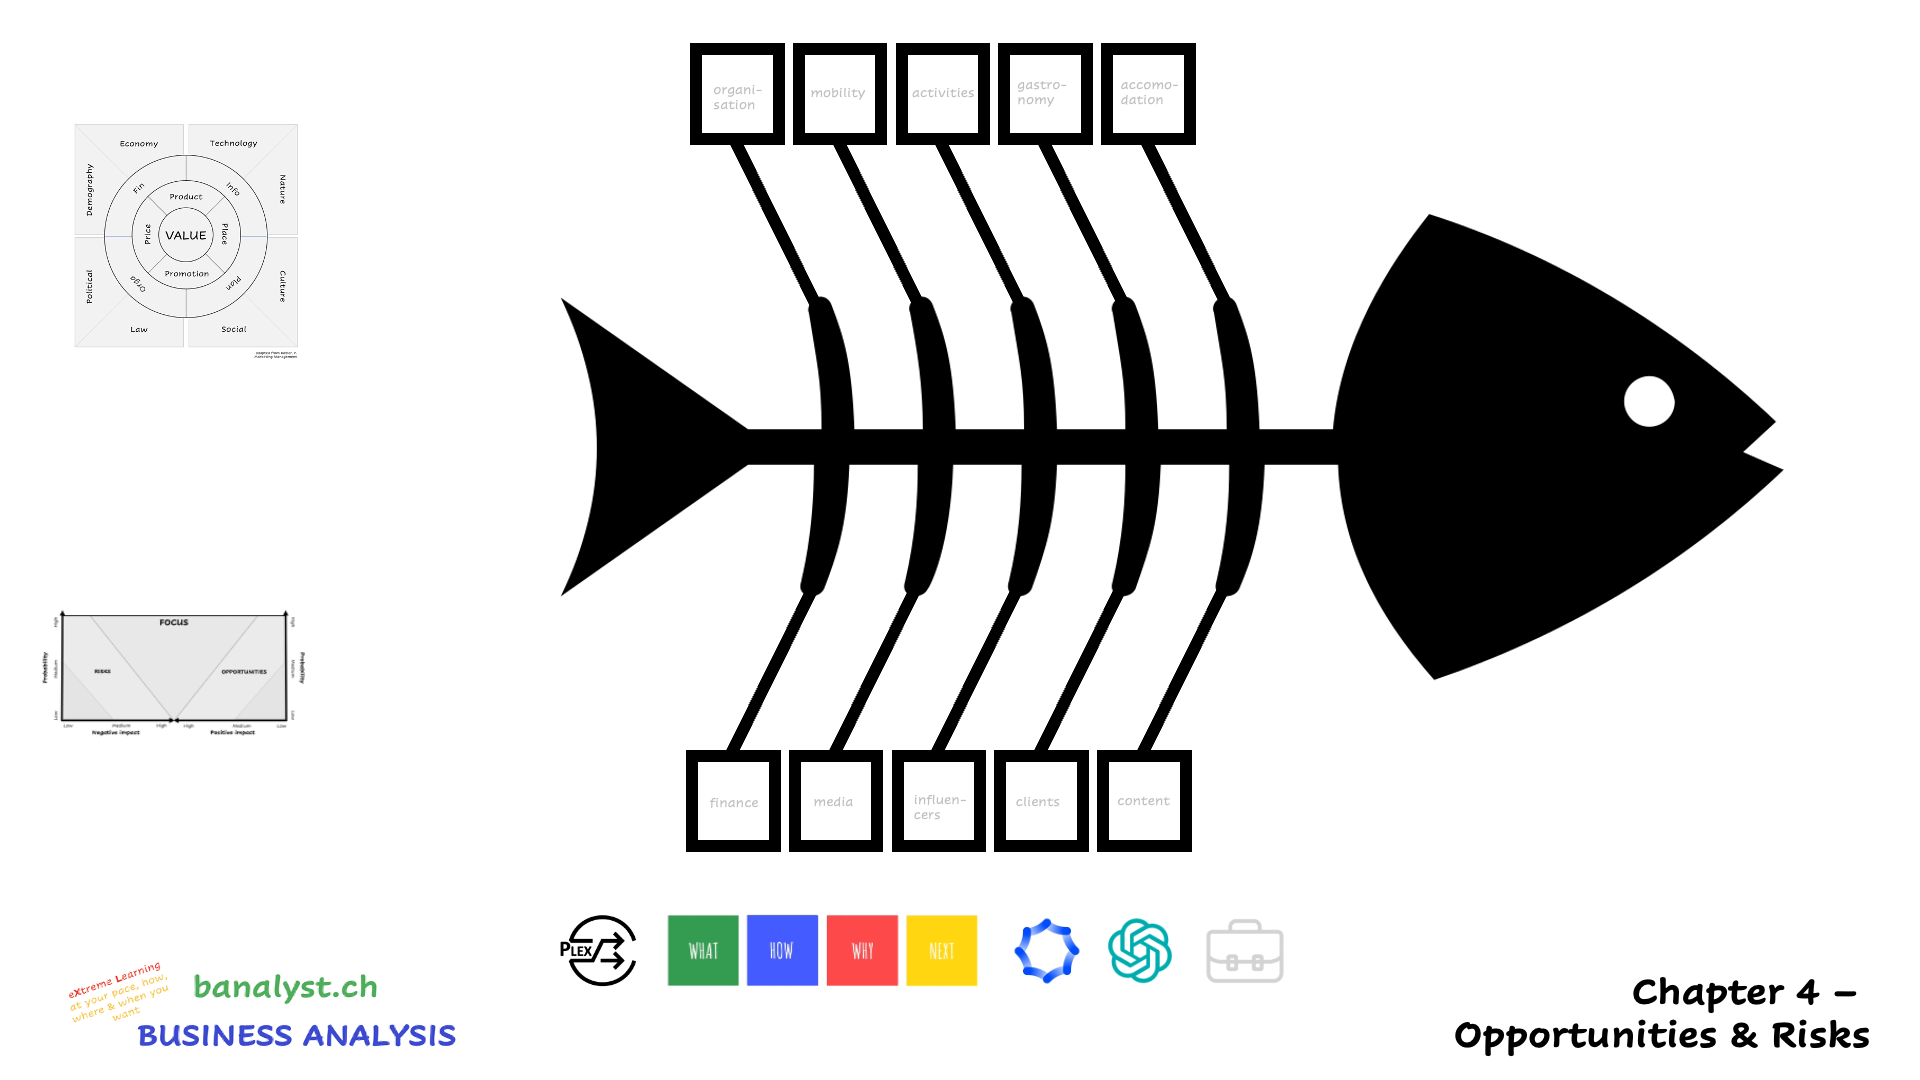
HEAD
In a Fishbone analysis, the "head" represents the main problem, issue, or effect that needs to be addressed. It's positioned at the right end of the diagram, summarizing the adverse outcome or challenge the analysis aims to resolve. This focal point guides the entire analysis, as the "bones" or branches extending from the spine aim to uncover various underlying causes contributing to the problem identified at the head.
WHAT
A fishbone diagram, also known as an Ishikawa diagram, is a tool used in business analysis to identify and visualize the various causes of a specific problem or effect, with the goal of pinpointing its root causes. The diagram is shaped like a fishbone, with the main problem or effect placed at the head, and the potential causes branching off the central "spine" into smaller "bones". These branches represent different categories of root causes, such as methods, machinery, people, materials, measurement, and environment, or more specific issues typically for tourism (examples are in grey in the graph). This helps teams systematically explore all aspects of a problem. It facilitates team brainstorming sessions and is valuable in quality improvement and problem-solving processes, encouraging a thorough analysis of contributing factors to complex issues.
HOW
To conduct a fishbone analysis, start by identifying the main problem or effect and place it at the head of the fishbone diagram. Then, brainstorm potential cause categories and draw them as main branches off the central spine. For each category, explore specific factors that might contribute to the problem, adding these as smaller branches. Encourage team collaboration to exhaustively consider all possible causes. Finally, analyze the diagram to identify root causes for further investigation or action.
WHY
A fishbone analysis is conducted in Business Analysis to systematically identify and explore all potential causes of a problem, rather than just the most apparent ones. This approach helps in uncovering the root causes of issues, leading to more effective and sustainable solutions. It promotes a thorough examination of processes, systems, and outcomes, encouraging collaborative problem-solving and enhancing the quality of decision-making within an organization.
NEXT
Here is a explanation of how the Fishbone Diagram can influence the chapters of the business analysis report:
- Problem Statement (2.2 Root cause analysis) - to detail the root causes identified through the Fishbone analysis.
- SWOT Analysis (5.2 Weaknesses) - to incorporate the internal factors that are causing issues or could be improved.
- Solution Options (6.1 Alternative solutions) - to outline potential solutions addressing the root causes identified in the Fishbone analysis.
- Business Case Development (7.3 Risk assessment and management) - to evaluate how identified root causes might pose risks to the project or business and how these risks can be managed.
- Implementation Plan (8.3 Responsibilities) - to assign responsibilities for addressing the root causes identified in the analysis as part of the project's action items.
PROMPT
[instruction]
Based on the [case], the [pestel],[swot],[porters], [business context], [power-interest], [stakeholder-trend], [opportunities], [risks] analyses done above, do a fishbone analysis. Return the result as a structured [fishbone] list with the following indented dimensions: [head] representing the root cause and then (if available) the elements as bulleted lists for the dimensions: [accommodation], [gastronomy], [activities], [mobility], [organization], [content], [clients], [influencers], [media], [finance]. Be factual, not creative. If there is no element for a dimension, cite it in the list but leave it empty.
CREDITS
Course : Business Analysis & Requirements Engineering
Institution : HES-SO Valais Wallis, 3960 Sierre
Teachers : Thomas Steiner & Catherine Tacchini
Credits
- FTO : X.XX ECTS
- FIG : X.XX ECTS
Objectives (with Babok 3 chapters)
- I understand comparing elicitation results against source information. 4.3.4.1
- I understand comparing elicitation results against other elicitation results. 4.3.4.2
- I understand current state. 6.1
- I understand future state. 6.2
- I follow rules for risk analysis. 6.3
- I have basic knowledge of identifying assumptions in order to manage risks. 7.3.4.1
- I have applied the fishbone diagram. (case study)
EXPLAINED
video explanations follow
PLEX
A PLEX, or Peer LEarning eXperience, is a self-contained, micro-learning unit created by students or teachers, designed to answer key questions like 'what?', 'how?', 'why?', and 'what's next?'. Each PLEX clearly outlines its learning objectives, associated micro-credits, and provides details about its original authors and their affiliations, making it a versatile resource for integration into various learning environments.
Link to MACROSCOPE analysis
Problem causes can appear everywhere in the Macroscope diagram. Each dimension can help to reflect on possible causes. Take them one by one and ask yourself if there might be a cause for your main problem.
Link to Opportunities-Risks analysis
The results of a risk analysis, particularly insights from the "arrow of attention" which highlights areas of significant concern or focus, can guide the structuring of a Fishbone analysis by identifying key risk factors to be explored as potential root causes. This information helps prioritize which areas to delve into during the Fishbone analysis, ensuring that the most critical and impactful issues are addressed first, leading to a more targeted and effective problem-solving process.
BONES
In a Fishbone analysis, the "bones" extend from the central "spine" and represent the various causes that contribute to the main problem identified at the head of the diagram. Each bone can signify a different category of potential causes. The graph contains tourist experience categories in light grey boxes. If you are in another context, cover them with post-its holding your specific categories of the customer experience. These bones branch out further into smaller lines, detailing specific factors within each category. This structure helps in systematically exploring and visualizing the relationship between different causes and the overall problem.
Tool 4.3 - CATWOE
WHAT
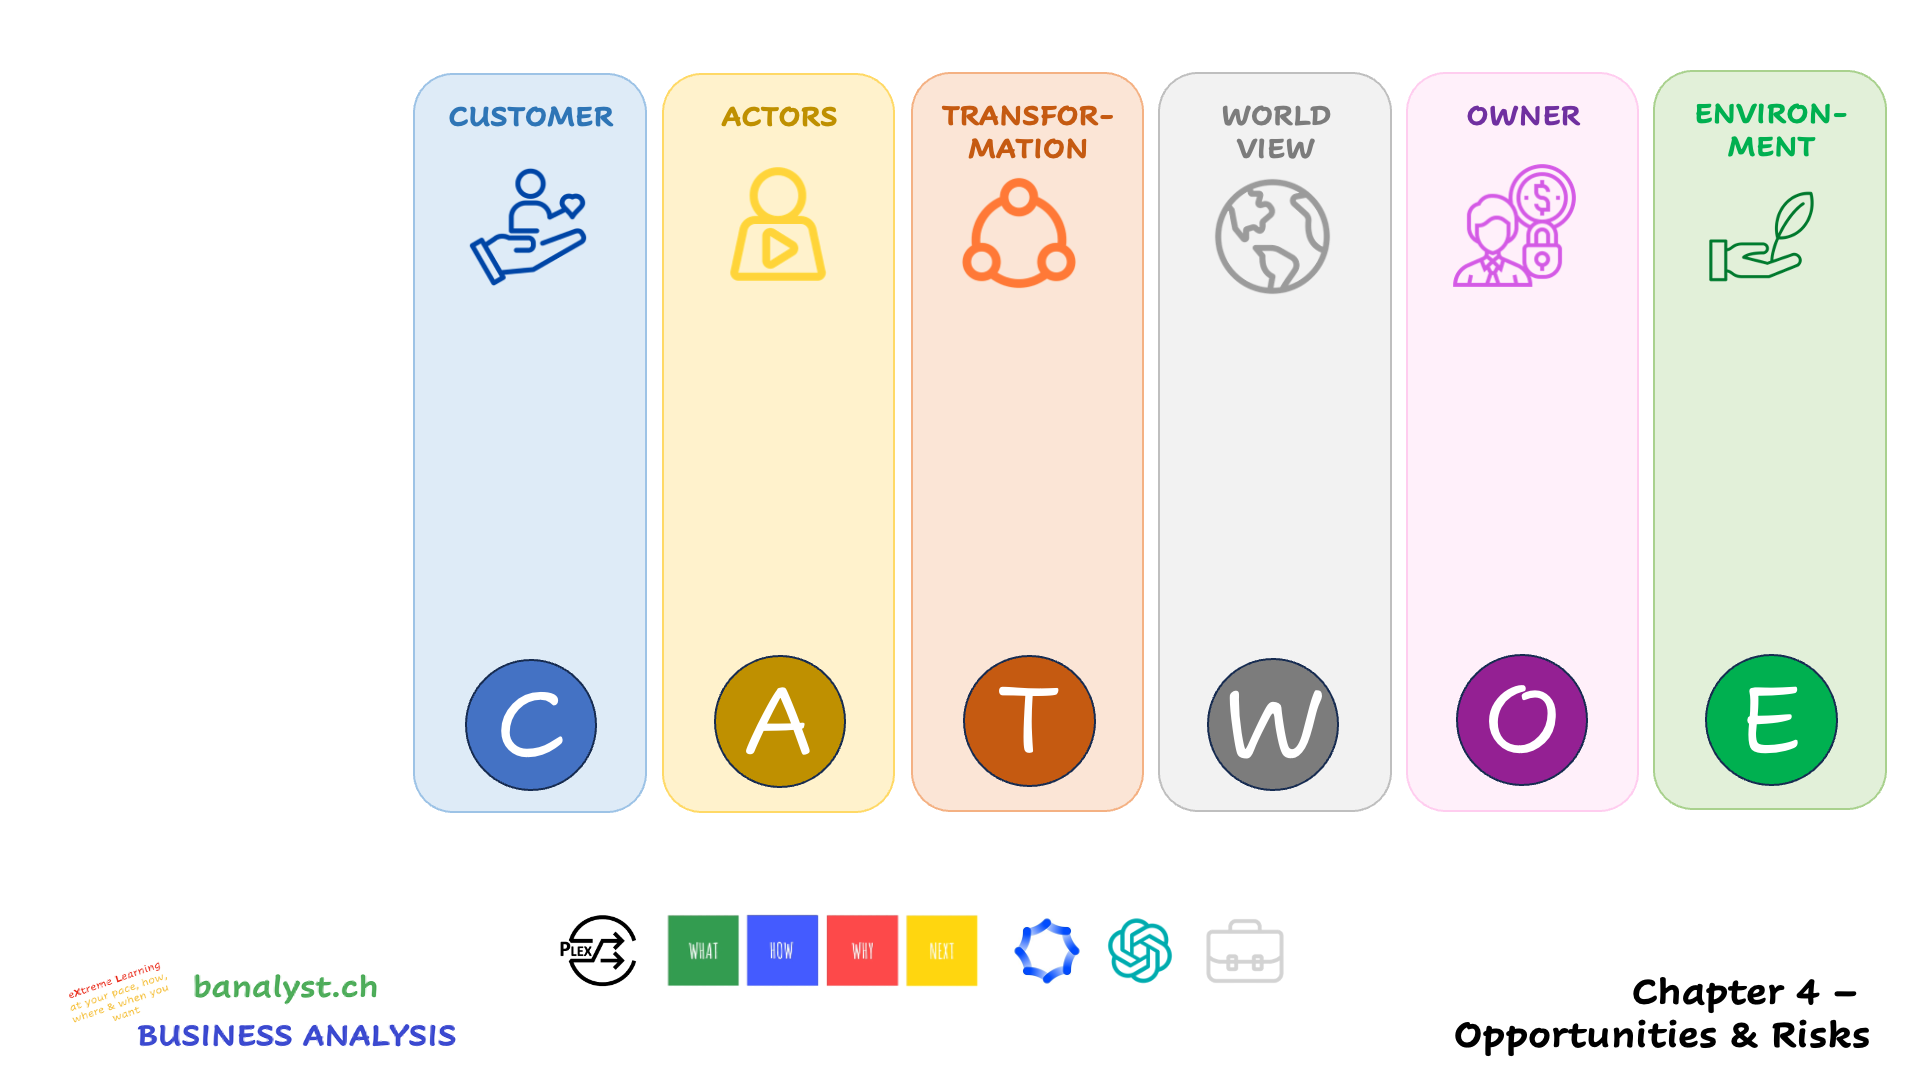
The CATWOE analysis is a tool used in business analysis to understand a problem or opportunity from multiple perspectives. It stands for Customers, Actors, Transformation Process, Worldview, Owner, and Environmental Constraints. Each element helps to consider different aspects of a situation, ensuring a comprehensive understanding. Customers are the beneficiaries of the process, Actors are involved in the operation, the Transformation process is the change occurring, Worldview is the big picture, Owner has the authority, and Environmental Constraints are external factors. This approach aids in creating solutions that are considerate of various stakeholders and factors.
HOW
To conduct a CATWOE analysis, you start by identifying and describing each of its elements in relation to the problem or situation you're analyzing: Customers (who benefits?), Actors (who's involved?), Transformation process (what change occurs?), Worldview (what's the bigger picture?), Owner (who owns the process?), and Environmental Constraints (what external factors influence?). This methodical approach helps to ensure a holistic understanding of the problem and its context, leading to more informed decision-making and solution development.
WHY
A CATWOE analysis is conducted in business analysis to ensure a comprehensive understanding of a problem or opportunity from multiple perspectives. This structured approach helps in identifying stakeholders' needs, considering different aspects of the situation, and understanding the broader impact of potential solutions. By analyzing the Customers, Actors, Transformation process, Worldview, Owner, and Environmental Constraints, business analysts can develop well-rounded, sustainable solutions that are more likely to meet the needs of all stakeholders involved.
NEXT
Here is a explanation of how the Fishbone Diagram can influence the chapters of the business analysis report:
- Introduction (1.3 Methodology and approach): Explain the use of CATWOE as part of the analytical approach.
- Problem Statement (2.1 Definition of the problem; 2.2 Root cause analysis): Utilize CATWOE insights to define the problem and identify root causes.
- Customer Analysis (4.1-4.3): CATWOE's 'Customers' component can deepen the understanding of customer segments, needs, and behaviors.
- SWOT Analysis: Align insights from the Worldview and Environmental Constraints elements of CATWOE with the Opportunities and Threats sections.
- Solution Options (6.3 Recommendation and justification): Use CATWOE analysis to support solution recommendations.
- Requirements: CATWOE can inform both functional requirements and priorities by clarifying stakeholders' needs and constraints.
PROMPT
[instruction]
Based on the [case], the [pestel],[swot],[porters], [business context], [power-interest], [stakeholder-trend], [opportunities], [risks], [fishbone] analyses done above, do a CATWOE analysis. Return the result as a structured [catwoe] list with the following indented dimensions: [customer], [actors], [transformation], [world view], [owner], [environment]. Find at least 5 elements for each dimension. Be creative, if there are elements missing, find and develop them.
CREDITS
Course : Business Analysis & Requirements Engineering
Institution : HES-SO Valais Wallis, 3960 Sierre
Teachers : Thomas Steiner & Catherine Tacchini
Credits
- FTO : X.XX ECTS
- FIG : X.XX ECTS
Objectives (with Babok 3 chapters)
- I understand comparing elicitation results against source information. 4.3.4.1
- I understand comparing elicitation results against other elicitation results. 4.3.4.2
- I understand current state. 6.1
- I understand future state. 6.2
- I follow rules for risk analysis. 6.3
- I have basic knowledge of identifying assumptions in order to manage risks. 7.3.4.1
- I have applied the catwoe diagram. (case study)
EXPLAINED
video explanations follow
PLEX
A PLEX, or Peer LEarning eXperience, is a self-contained, micro-learning unit created by students or teachers, designed to answer key questions like 'what?', 'how?', 'why?', and 'what's next?'. Each PLEX clearly outlines its learning objectives, associated micro-credits, and provides details about its original authors and their affiliations, making it a versatile resource for integration into various learning environments.
CUSTOMER
In the CATWOE analysis, the "Customer" refers to the individuals or groups who are the recipients or beneficiaries of the process being analyzed. These are the stakeholders who stand to gain or lose from the system or problem in question, and understanding their perspective is crucial to ensuring that any proposed solution meets their needs and addresses their concerns effectively.
ACTORS
In the CATWOE analysis, "Actors" are the individuals, groups, or entities who are directly involved in executing the activities within the system or process being analyzed. They are responsible for the operations that enable the transformation process, influencing the outcome and effectiveness of the solution or change. Understanding the roles, responsibilities, and capabilities of these actors is essential for designing feasible and impactful solutions.
TRANSFORMATION
The "Transformation" in a CATWOE analysis refers to the process through which inputs are converted into outputs within the system or situation being examined. It's about understanding what changes or actions occur as a result of the system's operations, focusing on the core activities that lead to the delivery of value or outcomes to the stakeholders, especially the 'Customers'. Identifying the transformation helps in pinpointing where and how value is added, which is crucial for analyzing and improving business processes or systems.
WORLD VIEW
The "Worldview" in a CATWOE analysis represents the big-picture perspective or the broader context within which the problem or situation exists. It encompasses the wider impacts, implications, and significance of the system or issue being analyzed, helping to understand its relevance and the rationale behind the need for change or improvement. This element encourages considering the broader societal, ethical, and environmental implications, ensuring solutions are aligned with larger goals and values.
OWNER
The "Owner" in a CATWOE analysis is the individual or entity that has control, authority, or ownership over the system or situation being analyzed. This could be a manager, a business unit, or an organization responsible for the process. Understanding who the owner is important for identifying who has the power to implement changes and for ensuring that any proposed solutions are aligned with their goals and constraints.
ENVIRONMENT
The "Environment" in a CATWOE analysis refers to the external factors, constraints, and conditions that impact the system or situation being examined. This includes regulatory, economic, social, and technological environments that can influence or limit the choices available for solutions and strategies. Understanding these environmental constraints is crucial for developing realistic and viable solutions that can operate successfully within the broader context.