Tool 3.1 - Business Context Diagram
Macroscope
Transferring the results from a prior Macroscope analysis into the Business Context diagram involves a thoughtful process of aligning the identified external and internal factors with candidate stakeholders. By analyzing these components, you can create a comprehensive list of potential stakeholders, both internal and external, who are relevant to the organization's context. These stakeholders can then be organized in the business context diagram, allowing for a clear visualization of their roles, importance, and interrelationships within the specific business context.
TEX - Tourist Experience Wheel
Transferring the results from a prior TEX into the Business Context diagram involves a thoughtful process of aligning the value chain with candidate stakeholders. Using the insights gained from the customer experience wheel, you can populate the business context diagram with stakeholders that are directly or indirectly involved in shaping the customer experience. This approach ensures a comprehensive view of all parties affecting or affected by the customer journey, thereby enhancing strategic planning and decision-making.
WHAT
A business context diagram is a visual tool used in business analysis to map out and understand the various stakeholders involved in a business or project. It helps in identifying who the key players are, how they are connected, and their relevance to the business or project's goals. This diagram typically includes stakeholders like customers, suppliers, partners, and internal departments, categorized based on their influence and role. By using a business context diagram, analysts can better grasp the broader environment in which the business operates, ensuring more informed decision-making. It's an essential tool for understanding the complex web of relationships that affect a business, making it easier for students to analyze and plan business strategies effectively.
HOW
- Start with Clear Objectives: Before creating a business context diagram, define the specific objectives or questions you want to address, as this will guide the identification and categorization of stakeholders.
- Identify All Relevant Stakeholders: Use various analysis tools like PESTEL, SWOT, and customer experience wheels to comprehensively identify stakeholders, including customers, suppliers, competitors, regulators, and internal departments.
- Categorize Stakeholders: Organize stakeholders based on their influence and importance to the project or business, distinguishing between those who are central to your objectives ("System Focus IN") and those who are less critical ("Out of the Focus").
- Visualize Relationships: Use arrows or lines to depict the relationships and interactions between different stakeholders, indicating the nature and strength of these connections.
- Review and Iterate: Regularly review and update the diagram as the project progresses or as new information emerges, ensuring that it remains a relevant and useful tool for understanding the business context.
WHY
- Enhances Stakeholder Understanding: A business context diagram provides a clear visual representation of all key stakeholders, including customers, suppliers, competitors, and internal teams, helping analysts understand their roles, influence, and relationships within the business environment.
- Facilitates Strategic Planning: By mapping out how stakeholders interact with each other and the business, the diagram aids in identifying opportunities and threats in the external environment, informing more strategic decision-making.
- Improves Communication: The visual nature of the diagram makes it easier to communicate complex stakeholder relationships and business dynamics to team members and stakeholders, ensuring everyone is on the same page.
- Supports Risk Management: Understanding the interdependencies and connections between stakeholders allows for better identification and management of potential risks and challenges that could impact the business.
- Guides Resource Allocation: By highlighting the most influential and critical stakeholders and their interactions, the diagram helps in prioritizing and allocating resources more effectively, ensuring focus on key areas that drive business success.
NEXT
Here is a explanation of how the Stakeholder-Trend Map can influence the chapters of the business analysis report:
- Background and Context (1.1): The business context diagram's results fit well into the "Background and Context" section, as they provide a foundational understanding of the stakeholder landscape and the business environment, setting the stage for the rest of the report.
- Problem Statement (2.2 and 2.3): The diagram's insights can be used in the "Root cause analysis" and "Impact and consequences" sub-chapters, offering clarity on how stakeholder dynamics might contribute to the problem and its effects on the business.
- Market and Industry Analysis (3.1 and 3.3): Results from the business context diagram contribute to "Market overview and trends" and "Industry analysis" by highlighting key players, market forces, and industry-specific stakeholder relationships.
- Customer Analysis (4.1, 4.2): The identification of customer segments and their needs, as outlined in the diagram, can enrich the "Customer segments and profiles" and "Customer needs and pain points" sections, offering a deeper understanding of the customer base.
- SWOT Analysis (5.3 Opportunities): Insights into the interactions and influences of various stakeholders can reveal potential opportunities for the business, which can be elaborated in the "Opportunities" part of the SWOT analysis.
PROMPT
[instruction]
Based on the [case], the [pestel],[swot],[porters] analyses done above, do a business context analysis. Find at least 5 stakeholders for each of the dimensions in and out representing respectively elements of the business context that are in or out of our problem focus. Return the result as a structured [business context] list with for each dimension an indented section between [] for example [in] and then the elements listed as bullet points, followed by the next section.
CREDITS
Course : Business Analysis & Requirements Engineering
Institution : HES-SO Valais Wallis, 3960 Sierre
Teachers : Thomas Steiner & Catherine Tacchini
Credits
- FTO : X.XX ECTS
- FIG : X.XX ECTS
Objectives (with Babok 3 chapters)
- I understand stakeholders. (2.4)
- I follow rules to gain stakeholder understanding and engagement. (3.1.4.6)
- I understand stakeholder analysis. (3.2.4.1)
- I have basic knowledge of stakeholder collaboration. (3.2.4.2)
- I have basic knowledge of understanding stakeholder communication needs. (3.2.4.3)
- I folllow rules to plan effective approval processes. (3.3.4.4)
- I understand stakeholder preparation for elicitation activity. (4.1.4.5)
- I understand determining objectives and format of communication. (4.4.4.1)
- I understand gaining stakeholder agreement. (4.5.4.1)
- I understand monitoring stakeholder engagement. (4.5.4.2)
- I understand collaborative stakeholder relationships. (4.5.4.3)
- I understand stakeholder roles and authority levels. (5.5.4.1)
- I have applied the business context diagram. (case study)
EXPLAINED
video explanations follow
PLEX
A PLEX, or Peer LEarning eXperience, is a self-contained, micro-learning unit created by students or teachers, designed to answer key questions like 'what?', 'how?', 'why?', and 'what's next?'. Each PLEX clearly outlines its learning objectives, associated micro-credits, and provides details about its original authors and their affiliations, making it a versatile resource for integration into various learning environments.
CANDIDATE STAKEHOLDERS
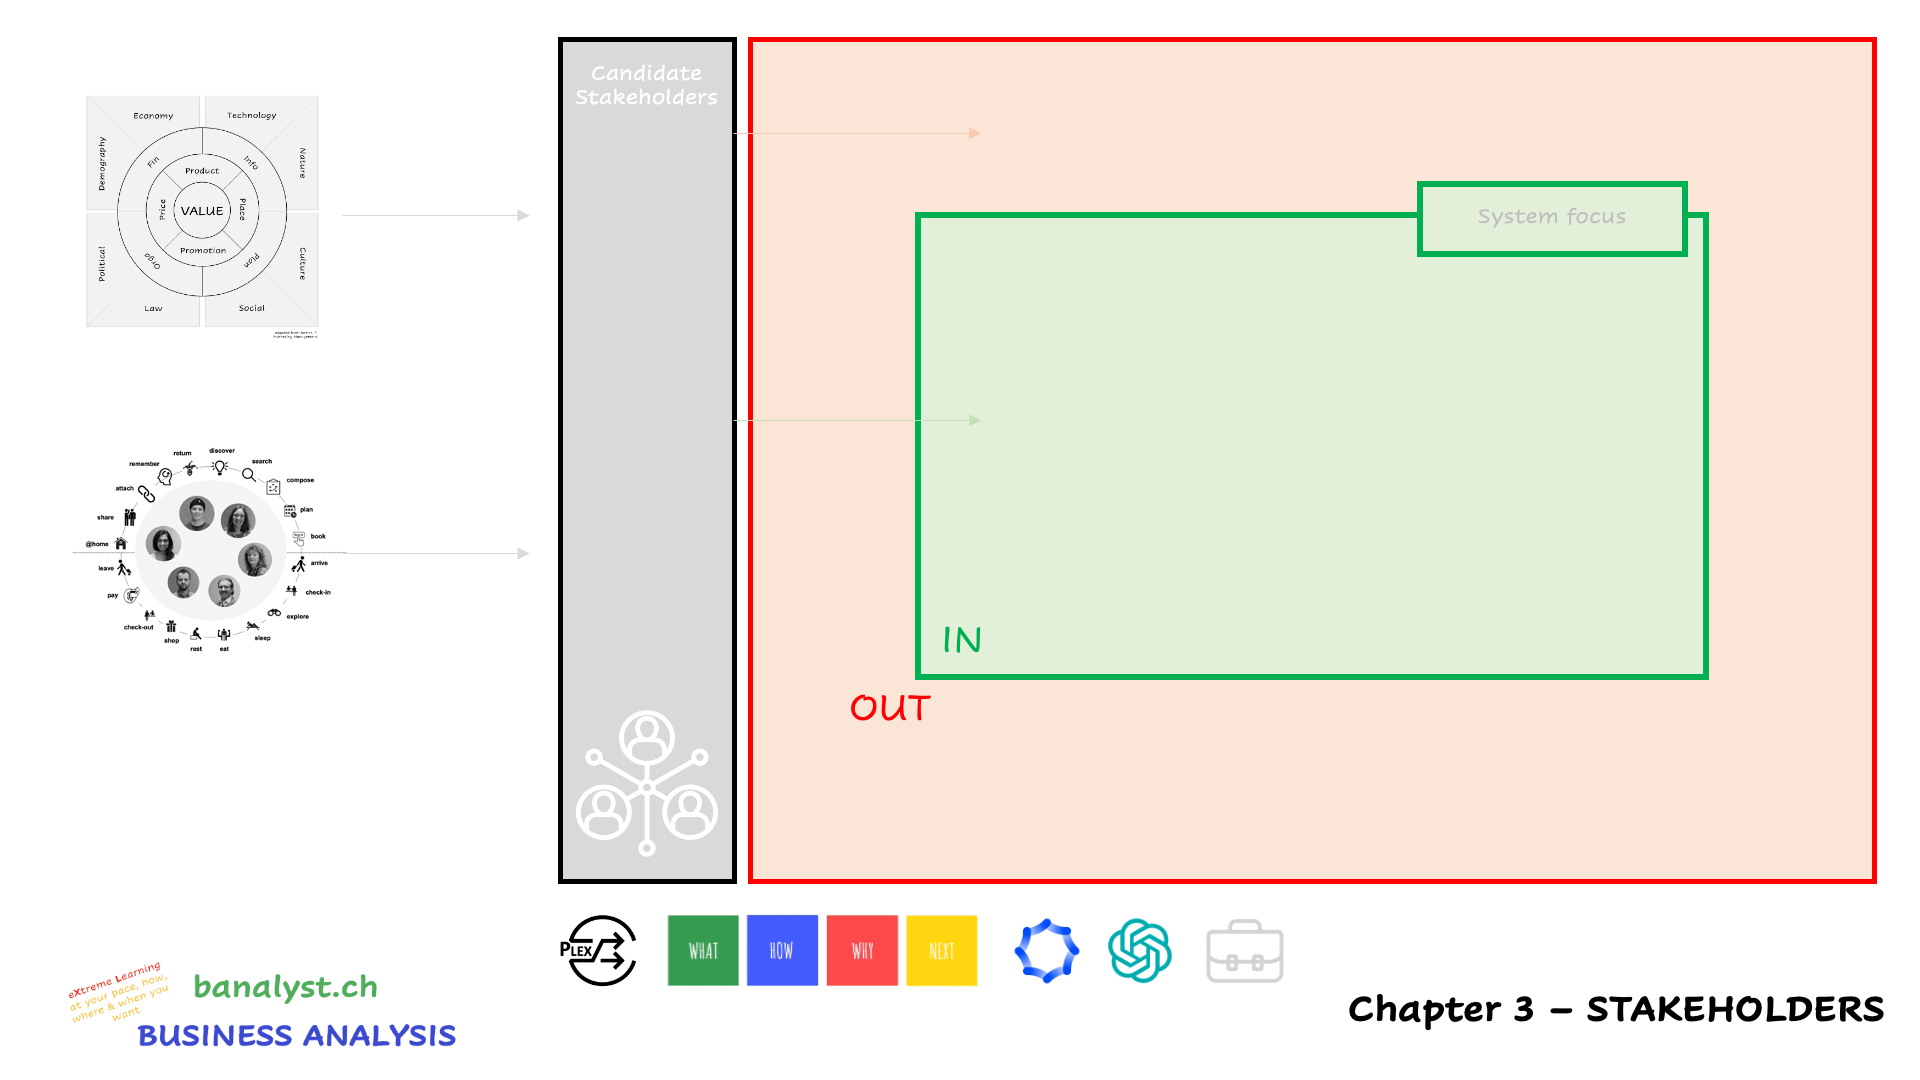
In a business context diagram, "Candidate Stakeholders" refer to the initial list of individuals, groups, or entities that might have an interest in or impact on the business or project. These stakeholders can include a wide range of parties such as customers, suppliers, employees, investors, regulatory bodies, and competitors. The identification of these stakeholders is typically the first step in creating the diagram and involves a comprehensive assessment of all potential players in the business environment. The purpose of listing candidate stakeholders is to ensure that no significant party is overlooked before analyzing their relevance and influence in the subsequent stages of the diagram. This list is then refined to distinguish between those stakeholders who are central to the business objectives and those who have a more peripheral role.
IN FOCUS ZONE
In a business context diagram, the "Green In System Focus" zone represents stakeholders who are deemed crucial or highly relevant to the business or project's objectives and success. This zone is used to categorize stakeholders that have a direct and significant impact on the business, such as key customers, primary suppliers, essential partners, and influential regulatory bodies. Stakeholders placed in this zone are those whose needs, actions, and feedback are prioritized in strategic planning and decision-making. The identification and inclusion of stakeholders in this zone highlight their importance in the operational and strategic framework of the business. By focusing on these stakeholders, businesses can allocate resources more effectively and tailor their strategies to engage and satisfy these critical entities effectively.
OUT OF SYSTEM FOCUS ZONE
In a business context diagram, the "Red Out of System Focus" zone is designated for stakeholders who are considered less critical or peripheral to the immediate goals and operations of the business or project. These stakeholders might still have some connection to the business, but their impact or influence is relatively minor compared to those in the "Green In System Focus" zone. Including stakeholders in this zone helps in prioritizing resources and attention towards more influential stakeholders, ensuring efficient use of efforts and resources. However, it's important to note that stakeholders in the red zone are not entirely disregarded; they may still require monitoring as their significance could change over time. The categorization into this zone aids in clarity and focus, allowing for a more strategic approach to stakeholder management and engagement.
Tool 3.2 - Power-Interest Map
HIGH-LOW (keep satisfied)
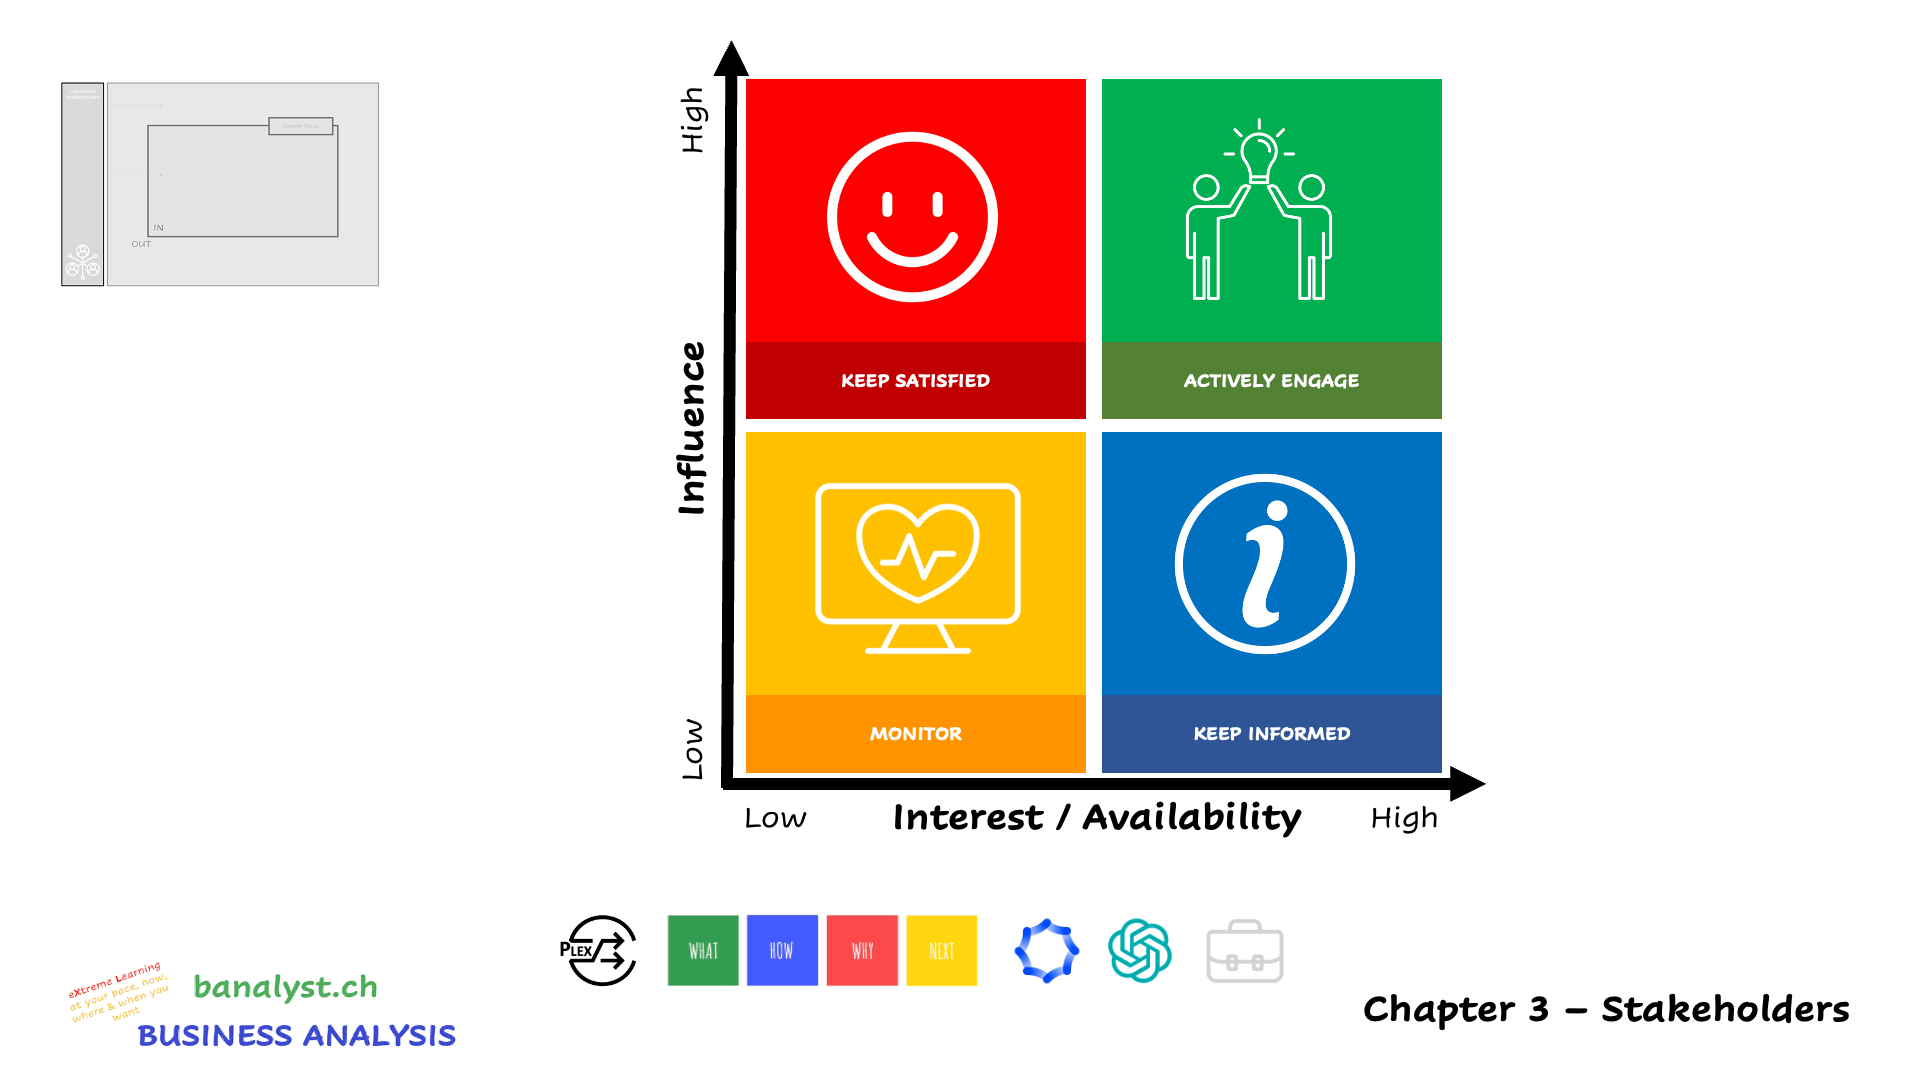
In the power-interest matrix, a stakeholder with high influence but low interest typically holds a significant amount of power to impact the project's outcomes but may not have a strong vested interest in the project itself. For these stakeholders, it's crucial to keep them satisfied by ensuring that their needs and concerns are adequately met without overburdening them with excessive communication or involvement. The goal is to maintain their support and prevent any negative impact on the project due to their high level of influence.
LOW-LOW (monitor)
Stakeholders with low influence and low interest typically have minimal impact on the project and also do not have a significant stake in its success or failure. They require minimal effort and resources, so the strategy is usually to monitor them on an occasional basis to ensure no major changes in their position. They are kept in the loop with basic information that could be relevant to them without active engagement or detailed updates.
LOW-HIGH (keep informed)
Stakeholders with low influence and high interest are those who are keenly interested in the project's progress and outcomes but lack the power to significantly affect its direction or results. The strategy for these stakeholders is to keep them informed with regular updates and communications, ensuring their high interest is acknowledged and valued, even though they may not have decision-making power. This approach helps maintain their support and can leverage their interest to promote positive outcomes, as their enthusiasm could influence others.
HIGH-HIGH (actively engage)
Stakeholders with high influence and high interest are key players in the project as they have both the ability to affect its outcomes and a strong vested interest in its success. They should be actively engaged with closely through regular and detailed communication, consultation, and potentially in decision-making processes. Their ongoing engagement and support are critical for the project, so they require focused attention to ensure their needs and concerns are addressed proactively.
Link to the Business Context Diagram
The Power-Interest matrix is a strategic tool used to prioritize stakeholders based on their level of influence and interest in a project. These stakeholders can be identified through analysis with other business tools, such as the Business Context Diagram. These analyses can reveal which stakeholders have significant power and interest and should therefore be positioned accordingly on the matrix for targeted engagement strategies.
WHAT
The power-interest matrix is a strategic tool used in business analysis to help understand the stakeholders related to a project or organization. It categorizes stakeholders based on two key criteria: how much power they have to influence the project, and how interested they are in the project's success or failure. By plotting stakeholders on a grid with 'power' on one axis and 'interest' on the other, analysts can identify which groups they need to focus on managing closely, keep satisfied, keep informed, or monitor. This helps in allocating resources and attention efficiently, ensuring that the most influential and interested parties are given priority. Ultimately, the matrix aids in stakeholder management by providing a visual representation of where each stakeholder stands in relation to the project.
HOW
To begin filling out a power-interest matrix, start by identifying all the stakeholders relevant to your project or business initiative. Stakeholders can include anyone affected by or capable of affecting the project's outcomes, such as employees, management, customers, suppliers, regulators, and even the community.
Once you have a comprehensive list, assess each stakeholder’s level of power, which is their ability to influence the project, and their level of interest, which is how concerned they are with the project's results. Power can be determined by their position, resources, or connections, while interest is gauged by the benefits or drawbacks they perceive from the project's success or failure.
After assessing each stakeholder, place them on the matrix in one of four quadrants: high power/high interest, high power/low interest, low power/high interest, or low power/low interest. This visual distribution will help you decide how to interact with each stakeholder, with those in the high power/high interest quadrant being the key players who need close engagement and those in the low power/low interest quadrant requiring less attention.
WHY
The power-interest matrix is important for business analysis because it offers a clear framework for identifying and prioritizing stakeholders in any project or organizational change. It shows how to assess the impact each stakeholder may have on a project, which is essential for effective stakeholder management. By understanding who to actively engage, who to keep satisfied, who to keep informed, and who to monitor, we can learn to allocate our efforts and communication strategically. This skill is crucial because mismanaged stakeholders can lead to project delays, increased costs, or even complete failure. Lastly, the matrix helps in fostering good relationships with stakeholders by understanding their needs and expectations, which is a key aspect of successful business outcomes.
NEXT
The results of the power-interest matrix might primarily go into the "Stakeholder Analysis" section of a report, which could be a sub-chapter under either "Introduction" or "Methodology and approach," depending on the report's structure. It details who the stakeholders are, their potential impact on the project, and the level of engagement required from them, which informs the approach to stakeholder management. Additionally, the matrix results could be part of the "Risk assessment and management" section in the "Business Case Development" chapter, as stakeholders with high power and interest may pose risks if not properly managed. Elements of the matrix might also be referenced in the "Implementation Plan," particularly when discussing responsibilities, to align stakeholder management with project execution. Lastly, the "Conclusion" might briefly touch on the matrix when summarizing strategic recommendations for managing stakeholder relationships moving forward.
PROMPT
[instruction]
Based on the [case], the [pestel],[swot],[porters], [business context] analyses done above, do a power-interest analysis. Place the stakeholders to the four dimensions high-influence/high-interest, high-influence/low-interest, low-influence/high-interest and low-influence/low-interest. Return the result as a structured [power-interest] list with for each dimension an indented section between [] for example [high-influence/high-interest] and then the stakeholders listed as bullet points, followed by the next dimension.
CREDITS
Course : Business Analysis & Requirements Engineering
Institution : HES-SO Valais Wallis, 3960 Sierre
Teachers : Thomas Steiner & Catherine Tacchini
Credits
- FTO : X.XX ECTS
- FIG : X.XX ECTS
Objectives (with Babok 3 chapters)
- I understand stakeholders. (2.4)
- I follow rules to gain stakeholder understanding and engagement. (3.1.4.6)
- I understand stakeholder analysis. (3.2.4.1)
- I have basic knowledge of stakeholder collaboration. (3.2.4.2)
- I have basic knowledge of understanding stakeholder communication needs. (3.2.4.3)
- I folllow rules to plan effective approval processes. (3.3.4.4)
- I understand stakeholder preparation for elicitation activity. (4.1.4.5)
- I understand determining objectives and format of communication. (4.4.4.1)
- I understand gaining stakeholder agreement. (4.5.4.1)
- I understand monitoring stakeholder engagement. (4.5.4.2)
- I understand collaborative stakeholder relationships. (4.5.4.3)
- I understand stakeholder roles and authority levels. (5.5.4.1)
- I have applied the power-interest grid. (case study)
EXPLAINED
video explanations follow
PLEX
A PLEX, or Peer LEarning eXperience, is a self-contained, micro-learning unit created by students or teachers, designed to answer key questions like 'what?', 'how?', 'why?', and 'what's next?'. Each PLEX clearly outlines its learning objectives, associated micro-credits, and provides details about its original authors and their affiliations, making it a versatile resource for integration into various learning environments.
Tool 3.3 - Stakeholder-Trend Map
Import PESTEL results
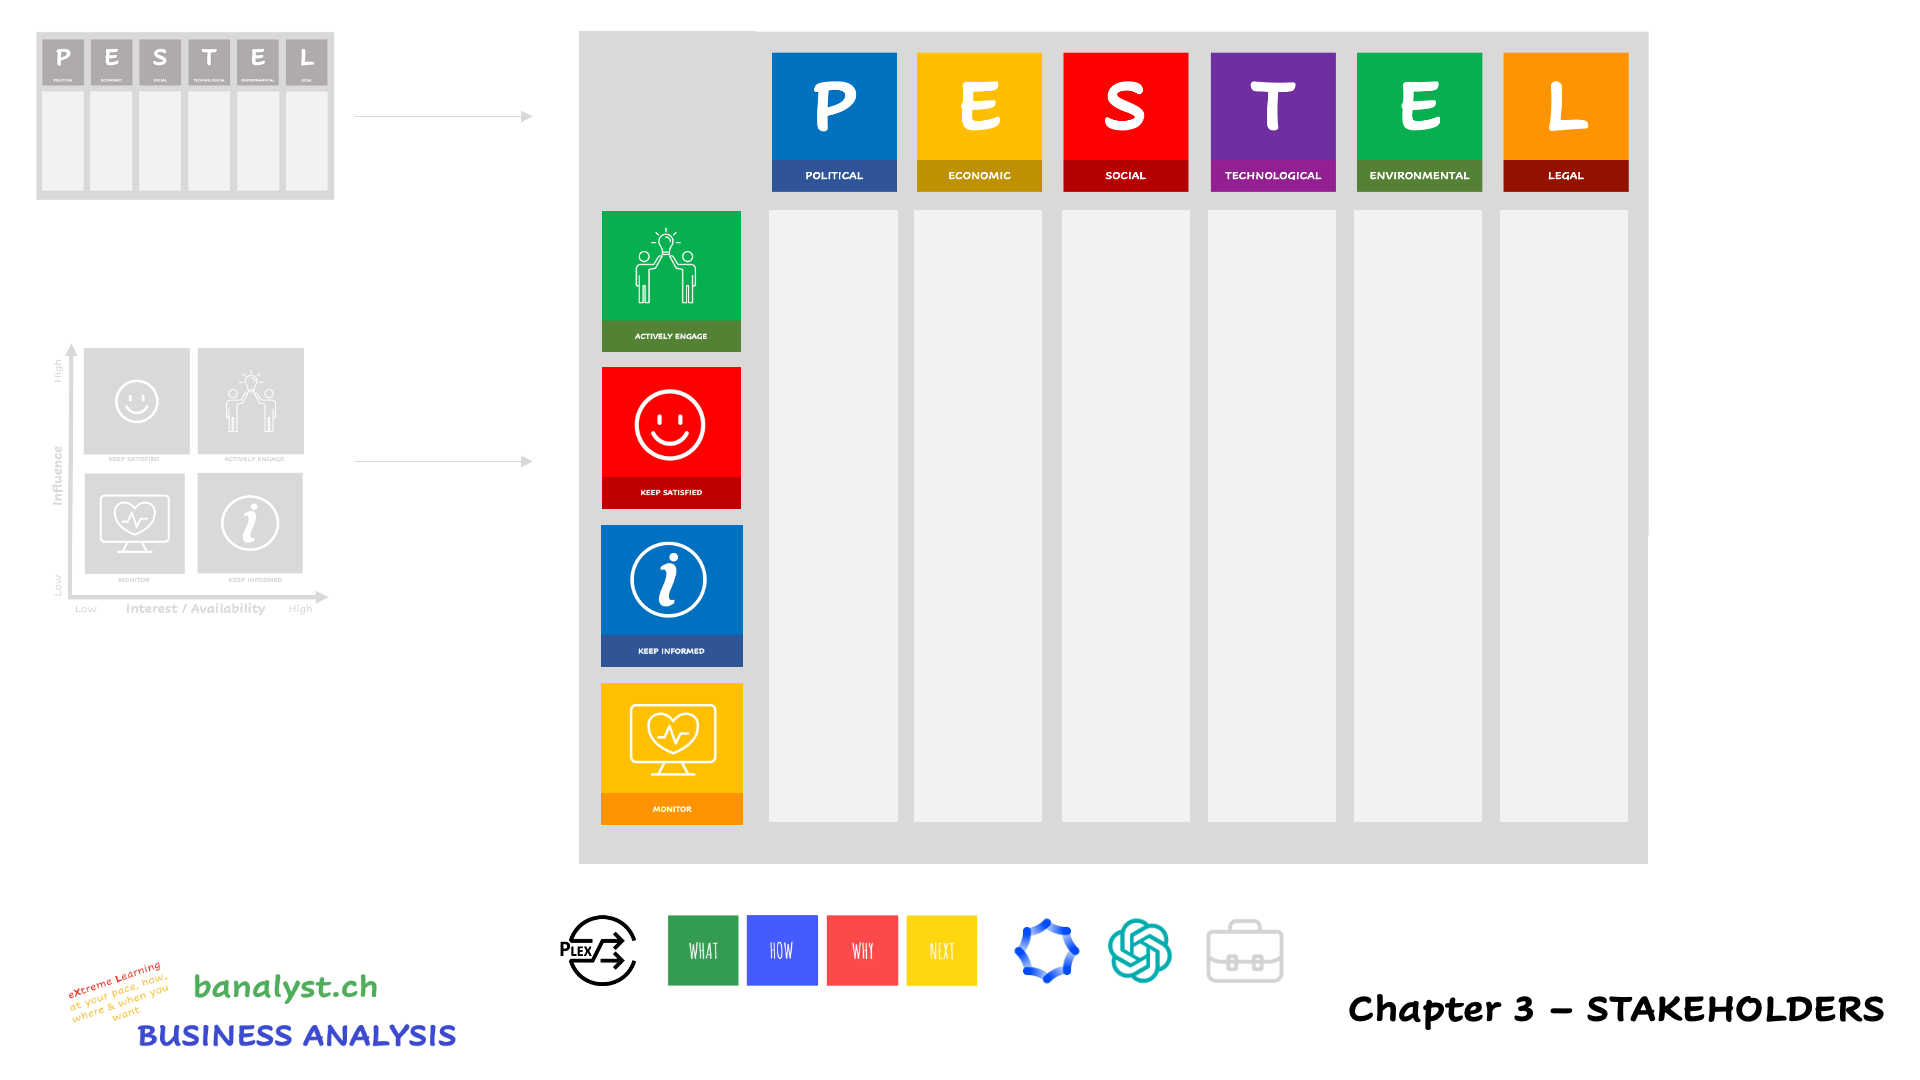
Transferring the results from a prior PESTEL analysis into the Stakeholder-Trend matrix involves a thoughtful process of aligning the identified external factors with the relevant stakeholders.
Import Power-Interest Map
By integrating the power-interest map with PESTEL trends, you can create a comprehensive view that helps in understanding not just who your key stakeholders are, but also how external factors are likely to affect them and your relationship with them. This holistic approach is vital for effective strategic planning and stakeholder management.
WHAT
The Stakeholder-Trend matrix is a strategic tool used in business analysis to identify how external trends impact different stakeholders of an organization. It combines a PESTEL analysis, which examines external factors like Political, Economic, Social, Technological, Environmental, and Legal trends, with a stakeholder analysis that assesses the influence and interest of various stakeholders like customers, employees, and suppliers. By plotting these elements on a matrix, it helps visualize which external trends are most relevant to each stakeholder group.
HOW
- Identify Key Stakeholders: Start by listing all relevant stakeholders of your organization, such as customers, employees, suppliers, investors, and regulators, and place them on the vertical axis of the matrix.
- Conduct a PESTEL Analysis: Perform a thorough PESTEL analysis to identify current and potential Political, Economic, Social, Technological, Environmental, and Legal trends, and place these on the horizontal axis of the matrix.
- Analyze Stakeholder Impacts: For each stakeholder, discuss and assess how each PESTEL factor could impact them, focusing on the likelihood and severity of these impacts.
- Prioritize and Visualize: Use color coding, symbols, or notes to highlight the most significant impacts on the matrix, helping to prioritize where attention and resources should be focused.
- Develop Strategies and Action Plans: Use the insights gained from the matrix to create strategies for addressing key trends and their impacts on stakeholders, ensuring your business strategy remains responsive to both external changes and stakeholder needs.
WHY
- Strategic Alignment: The Stakeholder-Trend matrix helps align your business strategy with external environmental factors and stakeholder needs, ensuring a holistic approach to decision-making.
- Anticipate Changes: By analyzing how PESTEL trends (Political, Economic, Social, Technological, Environmental, Legal) impact stakeholders, businesses can anticipate changes and adapt more effectively.
- Manage Stakeholder Relationships: This matrix provides insights into which stakeholders are most affected by external trends, allowing for more targeted and effective stakeholder management strategies.
- Risk Mitigation and Opportunity Identification: It aids in identifying risks and opportunities associated with external trends, enabling businesses to mitigate potential threats and leverage emerging opportunities.
- Facilitate Communication and Engagement: Understanding the intersection of stakeholders and external trends assists in tailoring communication and engagement strategies, enhancing stakeholder relations and support for business initiatives.
NEXT
Here is a explanation of how the Stakeholder-Trend Map can influence the chapters of the business analysis report:
- Market and Industry Analysis (Section 3): The insights from the Stakeholder-Trend matrix can be included in 3.1 (Market overview and trends) to illustrate how external PESTEL trends are influencing different market segments and industry dynamics.
- Customer Analysis (Section 4): The matrix's findings related to customer stakeholders can be detailed in 4.1 (Customer segments and profiles) and 4.2 (Customer needs and pain points), showcasing how external trends affect customer behavior and requirements.
- SWOT Analysis (Section 5): The external trends identified in the Stakeholder-Trend matrix can contribute to the Opportunities and Threats sections (5.3 and 5.4) of the SWOT analysis, providing a broader context to the internal assessment.
- Business Case Development (Section 7): In 7.3 (Risk assessment and management), the matrix can help identify risks arising from external factors impacting key stakeholders, aiding in comprehensive risk management planning.
- Conclusion (Section 10): The matrix's overall findings can be summarized in 10.1 (Summary of findings and recommendations), highlighting how external trends and stakeholder impacts influence the report's recommendations and strategic direction.
PROMPT
[instruction]
Based on the [case], the [pestel],[swot],[porters], [business context], [power-interest] analyses done above, do a stakeholder-trend analysis. A stakeholder-trend analysis cross-analyses the [power-interest] with the [pestel] analyses above. Return the result as a structured [stakeholder-trend] list with for each dimension of the [pestel] an indented [power-interest] section between [] for example [high-influence/high-interest] and then the combined commented elements listed as bullet points, followed by the next section / dimension.
CREDITS
Course : Business Analysis & Requirements Engineering
Institution : HES-SO Valais Wallis, 3960 Sierre
Teachers : Thomas Steiner & Catherine Tacchini
Credits
- FTO : X.XX ECTS
- FIG : X.XX ECTS
Objectives (with Babok 3 chapters)
- I understand stakeholders. (2.4)
- I follow rules to gain stakeholder understanding and engagement. (3.1.4.6)
- I understand stakeholder analysis. (3.2.4.1)
- I have basic knowledge of stakeholder collaboration. (3.2.4.2)
- I have basic knowledge of understanding stakeholder communication needs. (3.2.4.3)
- I folllow rules to plan effective approval processes. (3.3.4.4)
- I understand stakeholder preparation for elicitation activity. (4.1.4.5)
- I understand determining objectives and format of communication. (4.4.4.1)
- I understand gaining stakeholder agreement. (4.5.4.1)
- I understand monitoring stakeholder engagement. (4.5.4.2)
- I understand collaborative stakeholder relationships. (4.5.4.3)
- I understand stakeholder roles and authority levels. (5.5.4.1)
- I have applied the power-interest grid. (case study)
- I understand elicitation scope. (4.1.4.1)
- I understand selecting appropriate elicitation techniques. (4.1.4.2)
- I follow rules to set up logistics for elicitation activities. (4.1.4.3)
- I understand preparing supporting elicitation materials. (4.1.4.4)
- I understand guiding the elicitation activity. (4.2.4.1)
- I follow rules to capture the outcomes of the elicitation activity. (4.2.4.2)
- I understand communicating the appropriate level of detail. (4.4.4.2)
- I have applied PESTEL. (case study)
- I have applied the stakeholder-trend matrix. (case study)
EXPLAINED
video explanations follow
PLEX
A PLEX, or Peer LEarning eXperience, is a self-contained, micro-learning unit created by students or teachers, designed to answer key questions like 'what?', 'how?', 'why?', and 'what's next?'. Each PLEX clearly outlines its learning objectives, associated micro-credits, and provides details about its original authors and their affiliations, making it a versatile resource for integration into various learning environments.